Importing/Exporting Between R and Google Sheets
Problem
One of the weekly tasks I do is manually update a report inside google sheets to update a dashboard. Usually this would be easy - I would just pull the report from our data and paste it into the sheet. Unfortunately, the data I use often needs some reshaping that I cannot do in google sheets, so I export it to R.
The way I went about this was by downloading the sheet as a CSV from google, then importing it into R using read.csv and exporting it the same way after reshaping it. This led to a lot of errors and wasted a lot of time. There needs to be a way to automate this process.
Here I am going to show you a very easy way to do this without exporting and importing the file manually.
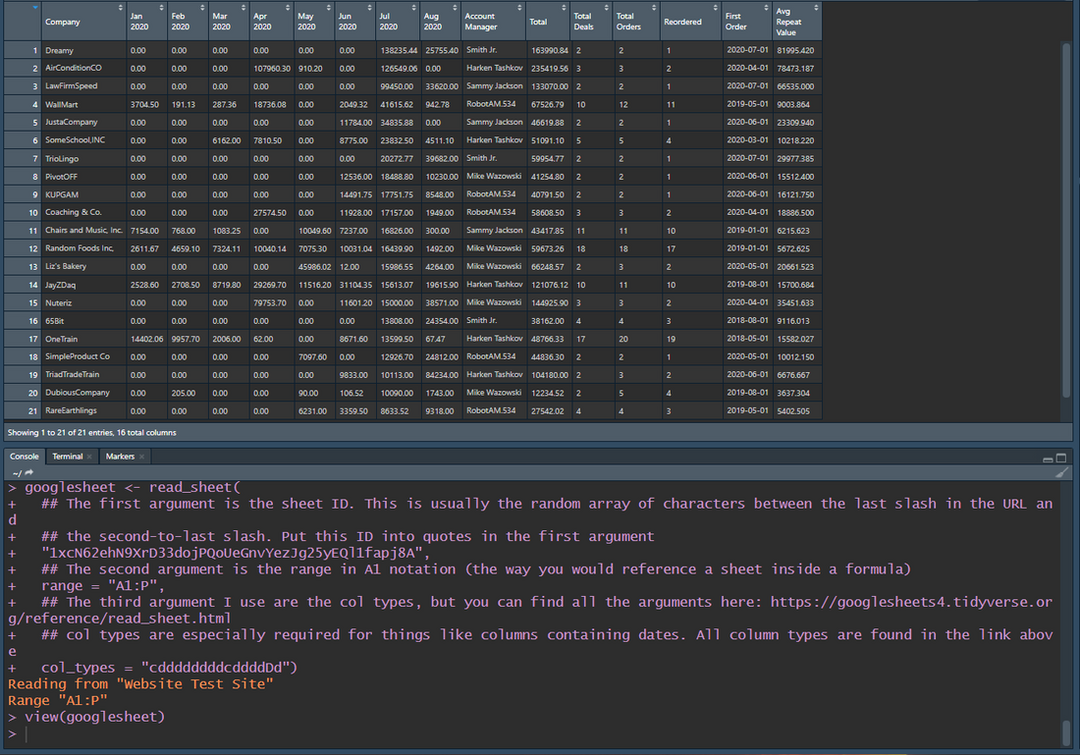
Let's use some sample data similar to the report I work with - but cut down drastically.
Starting from the left we start with the Company column, and the following columns are the columns representing revenue from each client within the header month. For example, OneTrain brought in $14402 worth of revenue in the January of 2020. On the right half of the table we see the account managers for each client, followed by the total client revenue within the year 2020. The Total Deals and Reordered columns are created using a formula, and the First Order column represents the first time a client ordered. The Average Repeat Value column is also created using a formula.
This table itself has 15 columns, and this might only be a fraction of the actual clients in the total report. Not only that, the information isn't easy to read or make pivot tables with. I want to see the revenue for each company per month in each row. There is an easy way to do this with R.
This table itself has 15 columns, and this might only be a fraction of the actual clients in the total report. Not only that, the information isn't easy to read or make pivot tables with. I want to see the revenue for each company per month in each row. There is an easy way to do this with R.
Bridging the gap
#PsuedoCode
read.csv(GoogleSheets.csv)
#Perform Reshaping/ Analysis on dataset
write.csv(GoogleSheets.csv)
#Continue in Google Sheets
This is the basic idea - there used to be an R package that was able to bridge the gap called "googlesheets". Since March of 2020 this package has been outdated and 'broken'. If you write gs_auth() to initiate the package: this error occurs.
library(googlesheets)
gs_auth(new_user = TRUE)
In this package, the app will not work and a common error occurs.
When we choose the account to connect Rstudio to, this error shows up for whatever account you choose. To circumvent this, we use the package "googlesheets4" instead to connect our account. This package is the updated version of "googlesheets"
install.packages("googlesheets4")
library(googlesheets4)
gs4_auth()
This will lead you to a Sign-In prompt like the one above, and you'll sign into your account containing your google sheets data. I want to perform a simple gather function on my data to display it in a different way. But first let's pull the sheet containing our data. The easiest way to do this is using read_sheet() from the package
Importing Data
library(tidyverse)
#Let's name the sheet we are importing 'googlesheet'
googlesheet <- read_sheet(
## The first argument is the sheet ID. This is usually the random array of characters between the last slash in the URL and
## the second-to-last slash. Put this ID into quotes in the first argument
"1xcN62ehN9XrD33dojPQoUeGnvYezJg25yEQl1fapj8A",
## The second argument is the range in A1 notation (the way you would reference a sheet inside a formula)
range = "A1:P",
## I use the third argument for the col types, but you can find all the arguments here: https://googlesheets4.tidyverse.org/reference/read_sheet.html
## col types are especially required for things like columns containing dates. All column types are found in the link above,
col_types = "cddddddddcddddDd")
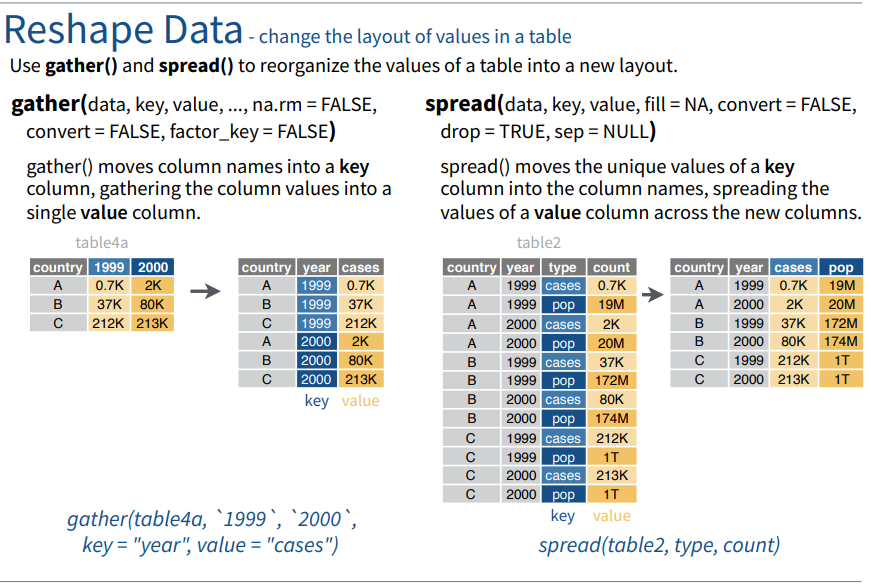
The google sheet data is now in Rstudio for analysis. Now let's shape the data using gather() as an example.
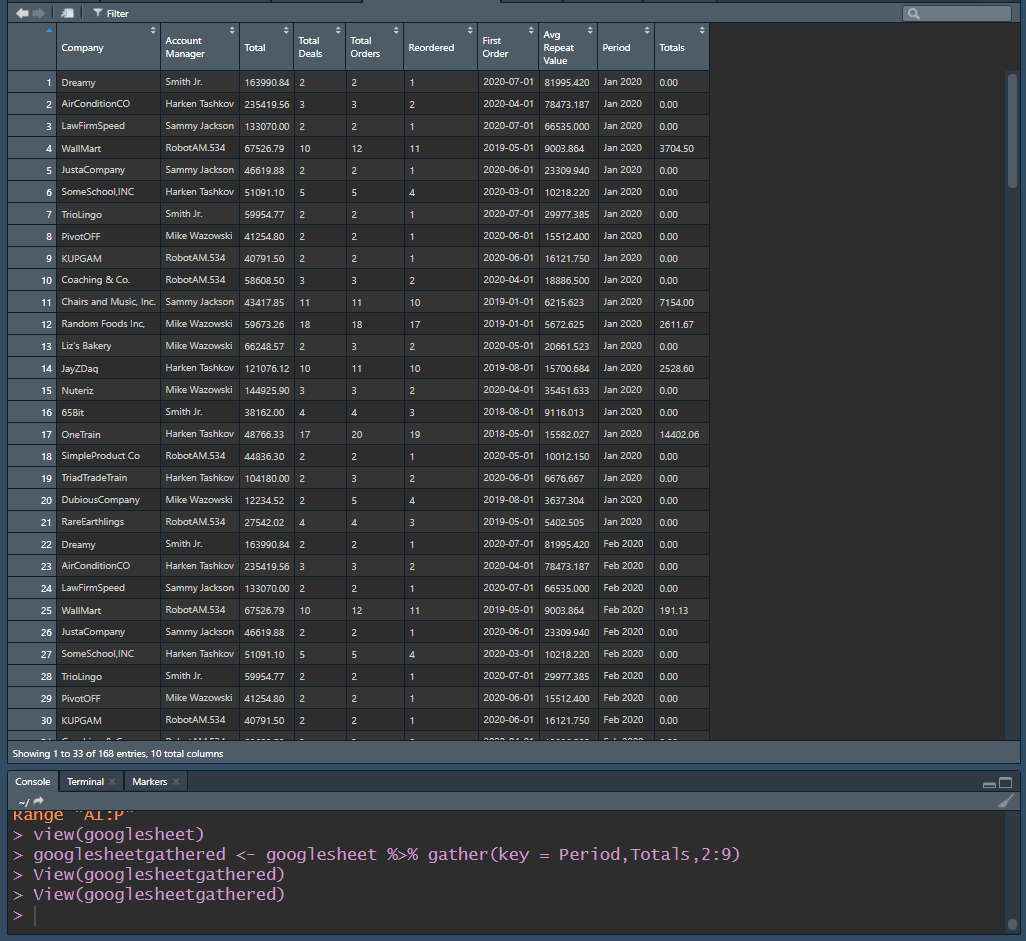
googlesheetgathered <- googlesheet %>% gather(key = Period,Totals,2:9)
## I am using the Period of the revenue and the total as the key. And I am using columns 2:9 as the key for this (since they are the Periods)
## The periods are where the revenue came from- and I want to see how much revenue each client made for each period.
view(googlesheetgathered)
Exporting Data
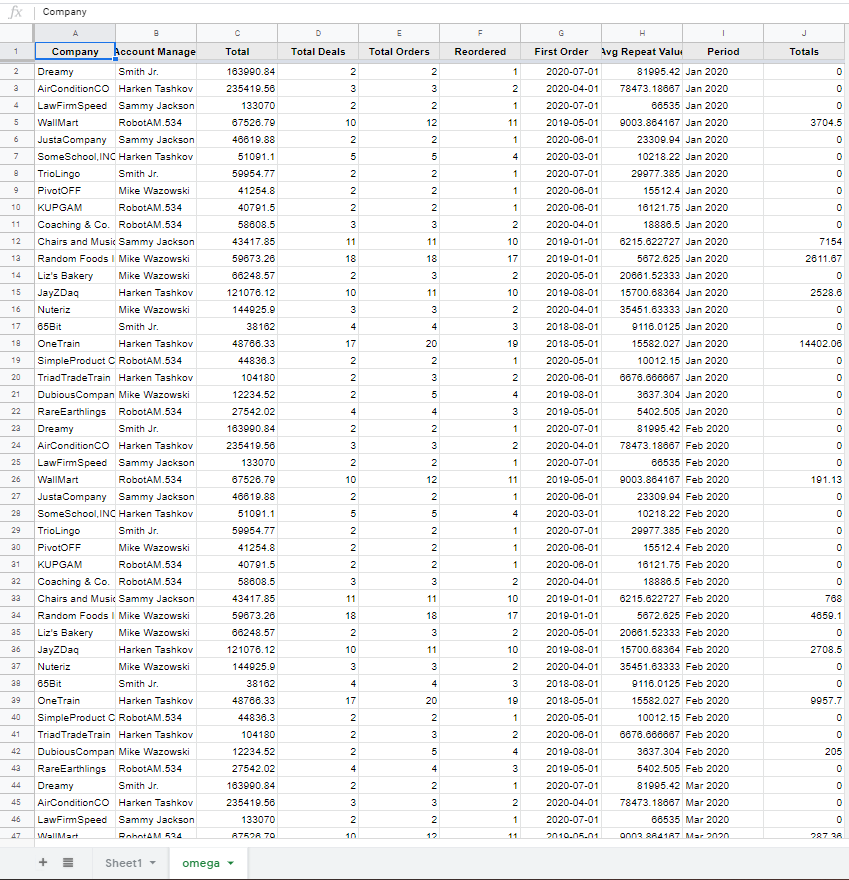
sheet_write(googlesheetgathered, ss = "1xcN62ehN9XrD33dojPQoUeGnvYezJg25yEQl1fapj8A", sheet = "omega")
#This function either imports the data into an already-named sheet 'omega' or it creates a new sheet named 'omega'
#ss is the ID for the sheet, and the first argument is the data we are using.
Fin
Now the sheet should be in your google workbook! Below you can see both sheets (the data used) and the data imported back into the Omega sheet.

